tf.keras
tf.keras를 사용하여 선형 회귀를 구현해보고자 한다.
import pandas as pd
import tensorflow as tf
from matplotlib import pyplot as plt
build_model(my_learning_rate)라는 빈 model을 build하는 함수와 train_model(model, feature, label, epochs)라는 model을 학습시키는 함수를 정의한다.
#@title Define the functions that build and train a model
def build_model(my_learning_rate):
  """Create and compile a simple linear regression model."""
  # Most simple tf.keras models are sequential.
  # A sequential model contains one or more layers.
  model = tf.keras.models.Sequential()

  # Describe the topography of the model.
  # The topography of a simple linear regression model
  # is a single node in a single layer.
  model.add(tf.keras.layers.Dense(units=1,
                                  input_shape=(1,)))

  # Compile the model topography into code that
  # TensorFlow can efficiently execute. Configure
  # training to minimize the model's mean squared error.
  model.compile(optimizer=tf.keras.optimizers.experimental.RMSprop(learning_rate=my_learning_rate),
                loss="mean_squared_error",
                metrics=[tf.keras.metrics.RootMeanSquaredError()])

  return model


def train_model(model, feature, label, epochs, batch_size):
  """Train the model by feeding it data."""

  # Feed the feature values and the label values to the
  # model. The model will train for the specified number
  # of epochs, gradually learning how the feature values
  # relate to the label values.
  history = model.fit(x=feature,
                      y=label,
                      batch_size=batch_size,
                      epochs=epochs)

  # Gather the trained model's weight and bias.
  trained_weight = model.get_weights()[0]
  trained_bias = model.get_weights()[1]

  # The list of epochs is stored separately from the
  # rest of history.
  epochs = history.epoch

  # Gather the history (a snapshot) of each epoch.
  hist = pd.DataFrame(history.history)

  # Specifically gather the model's root mean
  # squared error at each epoch.
  rmse = hist["root_mean_squared_error"]

  return trained_weight, trained_bias, epochs, rmse

print("Defined build_model and train_model")
다음으로 plotting function을 정의한다.
#@title Define the plotting functions
def plot_the_model(trained_weight, trained_bias, feature, label):
  """Plot the trained model against the training feature and label."""

  # Label the axes.
  plt.xlabel("feature")
  plt.ylabel("label")

  # Plot the feature values vs. label values.
  plt.scatter(feature, label)

  # Create a red line representing the model. The red line starts
  # at coordinates (x0, y0) and ends at coordinates (x1, y1).
  x0 = 0
  y0 = trained_bias
  x1 = feature[-1]
  y1 = trained_bias + (trained_weight * x1)
  plt.plot([x0, x1], [y0, y1], c='r')

  # Render the scatter plot and the red line.
  plt.show()

def plot_the_loss_curve(epochs, rmse):
  """Plot the loss curve, which shows loss vs. epoch."""

  plt.figure()
  plt.xlabel("Epoch")
  plt.ylabel("Root Mean Squared Error")

  plt.plot(epochs, rmse, label="Loss")
  plt.legend()
  plt.ylim([rmse.min()*0.97, rmse.max()])
  plt.show()

print("Defined the plot_the_model and plot_the_loss_curve functions.")
다음으로 나의 dataset을 설정한다.
my_feature = ([1.0, 2.0,  3.0,  4.0,  5.0,  6.0,  7.0,  8.0,  9.0, 10.0, 11.0, 12.0])
my_label   = ([5.0, 8.8,  9.6, 14.2, 18.8, 19.5, 21.4, 26.8, 28.9, 32.0, 33.8, 38.2])
hyperparameter를 정의하고 함수를 실행한다.
learning_rate=0.01
epochs=10
my_batch_size=12

my_model = build_model(learning_rate)
trained_weight, trained_bias, epochs, rmse = train_model(my_model, my_feature,
                                                         my_label, epochs,
                                                         my_batch_size)
plot_the_model(trained_weight, trained_bias, my_feature, my_label)
plot_the_loss_curve(epochs, rmse)
학습 결과를 보면 간단한 예시이기 때문에 오차도 높고 loss도 높은 것을 볼 수 있다.
Epoch 1/10
1/1 [==============================] - 1s 527ms/step - loss: 374.2511 - root_mean_squared_error: 19.3456
Epoch 2/10
1/1 [==============================] - 0s 13ms/step - loss: 364.2293 - root_mean_squared_error: 19.0848
Epoch 3/10
1/1 [==============================] - 0s 13ms/step - loss: 357.0904 - root_mean_squared_error: 18.8968
Epoch 4/10
1/1 [==============================] - 0s 11ms/step - loss: 351.1904 - root_mean_squared_error: 18.7401
Epoch 5/10
1/1 [==============================] - 0s 12ms/step - loss: 346.0096 - root_mean_squared_error: 18.6013
Epoch 6/10
1/1 [==============================] - 0s 14ms/step - loss: 341.3073 - root_mean_squared_error: 18.4745
Epoch 7/10
1/1 [==============================] - 0s 14ms/step - loss: 336.9496 - root_mean_squared_error: 18.3562
Epoch 8/10
1/1 [==============================] - 0s 14ms/step - loss: 332.8532 - root_mean_squared_error: 18.2443
Epoch 9/10
1/1 [==============================] - 0s 16ms/step - loss: 328.9627 - root_mean_squared_error: 18.1373
Epoch 10/10
1/1 [==============================] - 0s 13ms/step - loss: 325.2388 - root_mean_squared_error: 18.0344
/usr/local/lib/python3.8/dist-packages/numpy/core/shape_base.py:65: VisibleDeprecationWarning: Creating an ndarray from ragged nested sequences (which is a list-or-tuple of lists-or-tuples-or ndarrays with different lengths or shapes) is deprecated. If you meant to do this, you must specify 'dtype=object' when creating the ndarray.
  ary = asanyarray(ary)

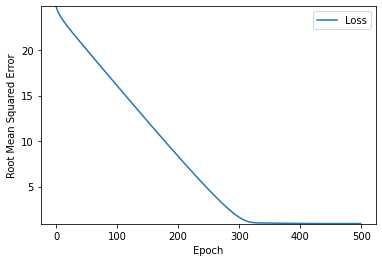
epochs=500으로 증가시켜봤다.


정확도가 높아지는 것을 볼 수 있다.
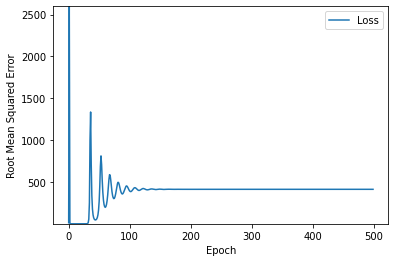
다음은 learning_rate=100, epochs=500으로 설정을 해봤다.


learning_rate가 너무 높아서 model에 문제가 생긴것을 볼 수 있다.
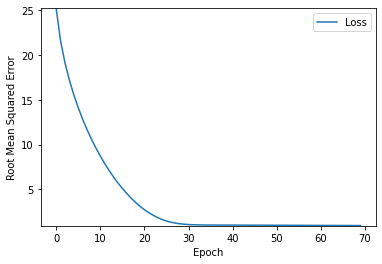
이상적인 learning_rate, epochs를 찾아보았다.
learning_rate=0.14, epochs=70으로 설정하면 이상적으로 보인다.


여기서 이상적이라는 것은 높은 정확도와 짧은 학습시간을 모두 챙기는 것을 의미한다.
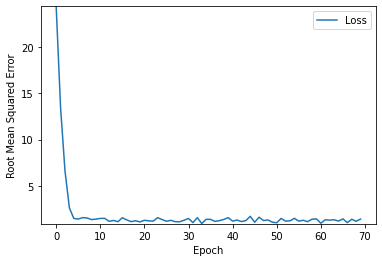
마지막으로 이상적인 learning_rate, epochs값을 바탕으로 batch_size를 1로 설정하고 실행을 해보았는데
예상외로 모델이 어느정도 잘 학습되는 것을 볼 수 있었다.


그러나 batch가 너무 작아 불안정한 모습이 보이는 것은 어쩔 수 없다.
Conclusion
Machine Learning에서는 hyperparameter tuning이 필수적이다. 하지만 모든 model에 대해 정해진 tuning 규칙이 있을 수는 없다.
학습 속도와 정확도 사이에서 저울질을 잘하는 것이 중요하다. 따라서 직접 실험을 진행하면서 적합한 hyperparameter를 찾아가야한다.
이때 몇가지 힌트가 될만한 기본 규칙이 존재한다.
1. training loss는 꾸준히 감소해야 하며 처음에는 가파르게 감소한 후 곡선의 기울기가 0에 도달하거나 0에 가까워질 때까지 점진적으로 느리게 감소해야 한다.
2. training loss가 수렴되지 않으면 epochs를 증가 시켜야한다.
3. training loss가 너무 느리게 감소하면 training rate를 키워야한다. 이때 training rate를 너무 크게 설정하면 training loss 수렴이 불가능해진다.
4. traing loss가 너무 크게 변화하면 training rate를 감소시켜야한다.
5. epochs나 batch의 크기를 늘리는 동시에 training rate를 감소시키는 것은 좋은 조합인 경우가 많다.
6. batch size가 너무 작으면 model이 불안정해진다. 따라서 batch size는 충분하게 잡고 성능 저하가 나타나기 전까지 batch size를
줄여가며 효율을 높인다.
7. 실제 데이터에서는 데이터의 크기가 굉장히 크기 때문에 메모리가 모두 담을 수 없는 경우가 많다. 이때는 batch size를 메모리에
적합하도록 조절해야한다.
8. hyperparameter의 이상적인 조합은 data에 따라 달라지기 때문에 항상 실험을 통해 검증을 하여 찾아야한다.
'Robotics & AI > Google' 카테고리의 다른 글
| Google ML crash course (7) (1) | 2023.03.07 |
|---|---|
| Google ML crash course (6) (0) | 2023.02.27 |
| Google ML crash course (4) (0) | 2022.12.26 |
| Google ML crash course (3) (0) | 2022.07.23 |
| Google ML Crash Course (2) (0) | 2022.07.23 |


